Context
Transport is the major contributor of nitrogen oxides (NOx) and contributes to 30% of the carbon dioxide (CO2) emissions. This pollution has a significant impact on global health and environment. To tackle and reduce these emissions, we need to understand them, in other words we need to understand who emits what, where and to what extent.
IFP Energies nouvelles (IFPEN) has developed for MAGPIE a digital and interactive visualisation tool of carbon emissions in port areas. Port cities are special places at the intersection between land and sea, and therefore their impact on CO2 emissions is due to both land and sea activities.
Let us take a moment to understand how these different contributions to the overall carbon footprint of port areas can be modelled and estimated.
Road-traffic emissions estimation
Vehicles emissions are typically estimated using detailed emission models that process speed and position measurements as input (e.g., GPS data), and yield as output the second-by-second emissions. These models, often called « microscopic », depict complex dynamics, such as the vehicle motion, the propulsion, and the after-treatment system[1]. Due to their high computational load, these microscopic models can only be used for small-scale applications (e.g., emission estimation of trips).
In MAGPIE, our goal is to estimate emissions of road traffic, on large areas and on each road segment (or link) of a traffic network. To this aim, a « mesoscopic » emission model was developed to estimate the link-level emissions of road traffic from three inputs: road characteristics obtained from a geographic information system, estimated traffic flow[2], and vehicle fleet composition.
More precisely, for each type of vehicle representative of the fleet composition, road traffic emissions are computed using a model that takes as input the road characteristics (i.e., speed bumps, stop or yield signs, traffic lights, pedestrian crossings, roundabouts, the traffic speed over the road link, the speed limit, the slope, and the curvature), and returns as output emissions per unit distance (e.g., in g/km). Then, multiplying the output by the estimated traffic flow (i.e., number of vehicles per hour), we can obtain the instantaneous link-level emissions per unit time (e.g., in g/s). Thus, these emissions vary during the day with the congestion and the speed of vehicles.
Port-activities emissions estimation
Within the port territory, we cannot directly apply the same methodology as for road traffic because of the lack of information about road characteristics and traffic flow.
The partner CEA has developed for MAGPIE a simulation tool that generates synthetic data about missions of different types of vehicles within a virtual container terminal. From this we can calculate a typical hourly profile of twenty foot-equivalent unit (TEU) movements for a typical day of port activities.
Considering the typical weight of truck tractors, the mean weight of a TEU, and a long-haul truck emission factor in kg/ton/km, we can estimate a truck emission factor in g/TEU and modulate it with the TEU hourly profile previously obtained.
The same procedure is applied for straddle carriers, for which, in collaboration with the partner CIRCOE, we estimate carbon emissions per movement, as well as the number of movements to move a container, to compute carbon emissions per container.
For lifting cranes, the energy consumption per movement is converted to CO2eq, and the carbon emissions per container are obtained in the same way as for straddle carriers. To finally obtain carbon emissions per TEU, a typical scaling factor for converting from number of containers to number of TEUs was selected together with the fellow ports of MAGPIE.
Lastly, considering the annual TEU and modal share of port activities (i.e., ratio of transhipments, ratio of containers leaving the port via land or rivers) communicated by the fellow ports of MAGPIE, we can estimate on-land emissions produced by trucks, straddle carriers and lifting cranes per TEU per hour. Annual emissions produced by vessels at berth are available for major ports and can be similarly transposed to hourly emissions.
Interactive digital tool
The interactive digital tool is still under development and IFPEN and partners within the MAGPIE project are working hard to further improve the tool, to benchmark, verify and improve the data and input. Therefore, the numerical values appearing in the following are not final and are provided for illustrative purposes only.
IFPEN’s interactive visualisation tool will consist of two main pages: aggregated statistics and geographical representation on a map.
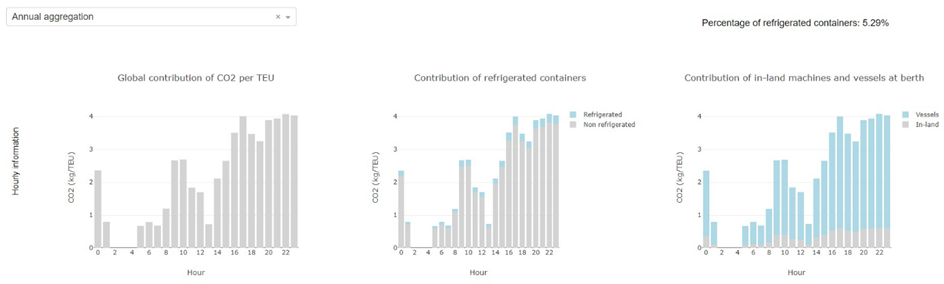
The aggregated statistics indicators, as shown in the following figure (left-hand side graph), allow one to assess the hourly carbon emissions per TEU for a typical day of port operations. When data are available, it is possible to further explain and understand the relative contribution to carbon emissions due to refrigerated containers (middle graph) and to different types of port machines involved with container operations (right-hand side graph).
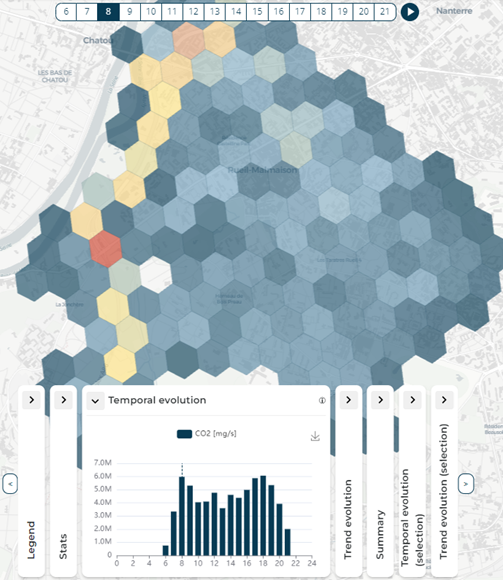
Moving on to the map, one can evaluate city road-traffic emissions for a specific simulated area. The tile visualization on the map shows that main road arterials and highways contribute to CO2 emissions to a larger extent. The bar graph at the bottom of the page shows, in an aggregated fashion, the hourly CO2 emissions due to road traffic.
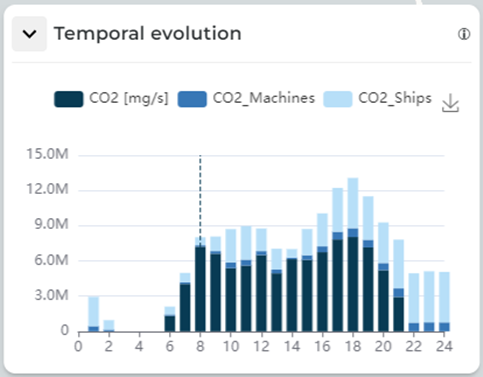
Finally, the idea for MAGPIE is to extend this analysis for port areas by integrating the CO2 contribution of port activities. This can be rendered with a stacked bar graph showing the relative hourly contribution of different contributors to the overall CO2 emissions, as illustrated in the following figure.
Coming soon
Estimation of other types of emissions, such as local pollutant emissions (e.g., NOx) is currently under development. This will allow us to enrich the tool with an air-quality flavour for MAGPIE.
The geographical areas to simulate will be fine-tuned considering the ports’ feedback.
Interactions with Demo 10 are under consideration for the simulation and the impact assessment of scenarios in which the road traffic due to trucks is spread towards the off-peak hours of the city road traffic.
Stay tuned!
Contact: Giovanni De Nunzio, R&I Project leader, IFPEN, giovanni.de-nunzio@ifpen.fr
[1] De Nunzio G, Laraki M, Thibault L. Road Traffic Dynamic Pollutant Emissions Estimation: From Macroscopic Road Information to Microscopic Environmental Impact. Atmosphere. 2021; 12(1):53.
[2] M. Laraki, G. De Nunzio and B. Othman, “A Large-Scale and Data-Based Road Traffic Flow Estimation Method Leveraging Topography Information and Population Statistics,” 2022 IEEE 25th International Conference on Intelligent Transportation Systems (ITSC), Macau, China, 2022, pp. 2343-2349